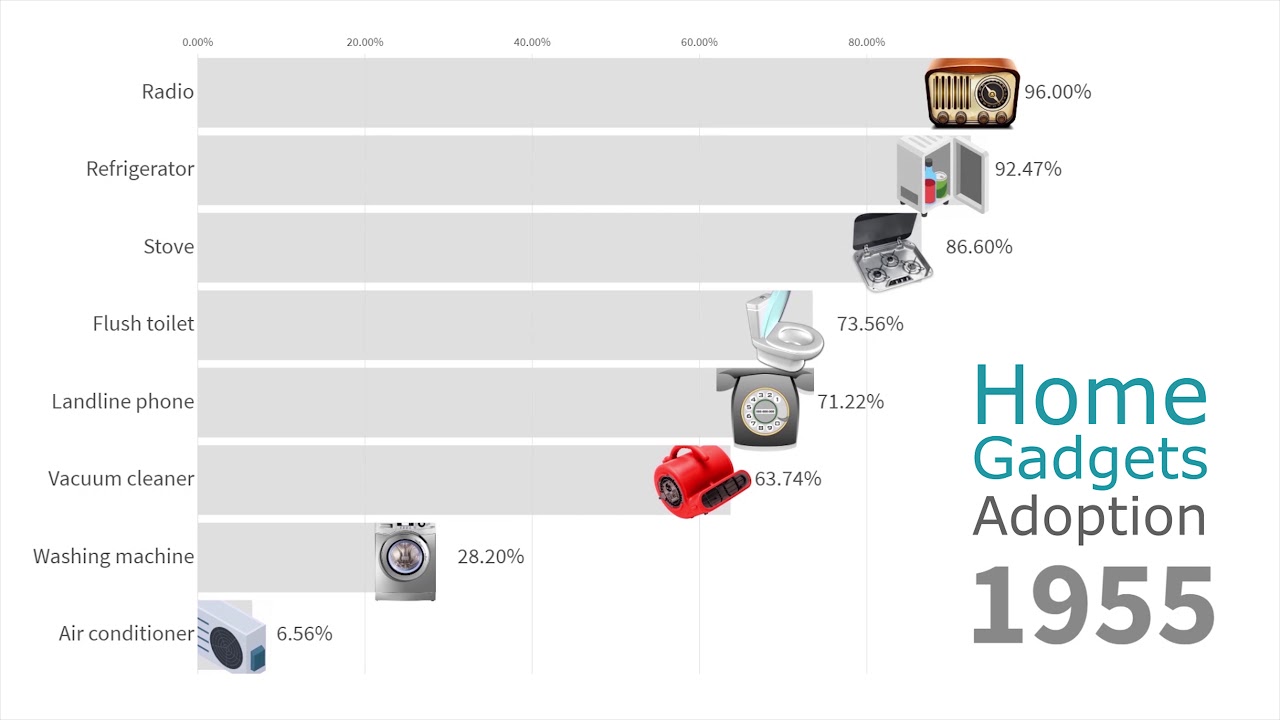
The rates of adoption of home gadgets in the United States, measured as the percentage of US households with gadgets adoption over time 1910 — 2019.
I am a first year PhD student, data geek and I love visualizations.
As always your feedback is welcome.
Please support my channel. It can buy me another cup of coffee 🙂
Data source: Scholarly work, census data
Most Popular Home Gadgets in US Households 1910 — 2019